
July 11, 2026 • 7 min read
Ask an experienced skipper what they check before casting off and you'll get some version of the same short list: is it going to rain, how much wind, how big the seas, which way the current sets, and what the tide is doing. Everything else is detail. Get those right and the day mostly takes care of itself.
SeaVectors puts all five on your chart, in one panel — Rain, Wind, Waves, Currents, and Tides. But it's worth understanding that they come from two different kinds of source, because knowing which is which tells you how to read each one and how much to trust it.
Open a familiar cruising area and compare rain, wind, waves, currents, and tides directly on the chart. The 30-day free trial includes the complete experience, so you can evaluate SeaVectors with the conditions that matter to your boating before deciding whether to subscribe.
- Download SeaVectors on the App Store
- Get SeaVectors on Google Play
- Not ready to install? Open the lightweight web chart for a quick preview.
Rain, wind, and waves: forecast models, and you pick
Precipitation, wind, and wave height are forecasts — computed on a grid by a weather model — and SeaVectors lets you choose which model you're looking at. That's not a gimmick. Different models are better in different places, and being able to switch between them is how you build confidence in a forecast.
By default it runs on Auto, which selects the official source for wherever you're looking. Open the model picker and you can choose deliberately:
NOAA NWS — US coastal, official National Weather Service data.
Env Canada — a blend of Environment Canada and GEM for Canadian waters.
GEM · Canada — a high‑resolution 2.5 km model, the recommended choice on the BC coast.
ECMWF IFS, ECMWF AI, GFS, Météo‑France, and a "best match" option — global and regional models for everywhere else.
The trick the pros use: when two independent models agree, trust the forecast; when they disagree, expect uncertainty and plan conservatively. Being able to flip between NOAA and ECMWF over the same waters, on the same chart, turns that from a chore into a glance.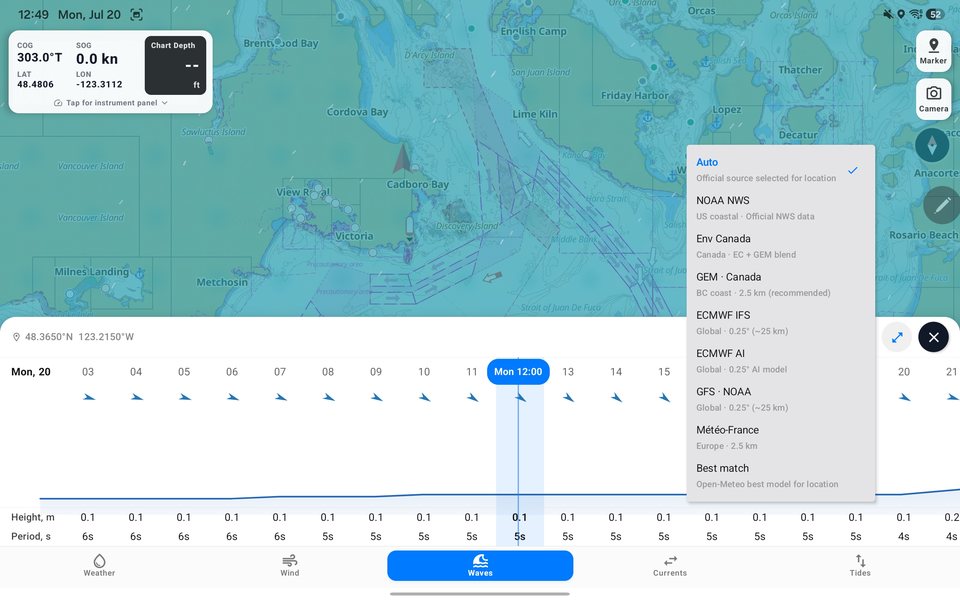
Image: the model picker open, each model showing its coverage and resolution. Caption: "Choose your forecast model — high‑res regional where it exists (GEM 2.5 km on the BC coast), global models everywhere else."
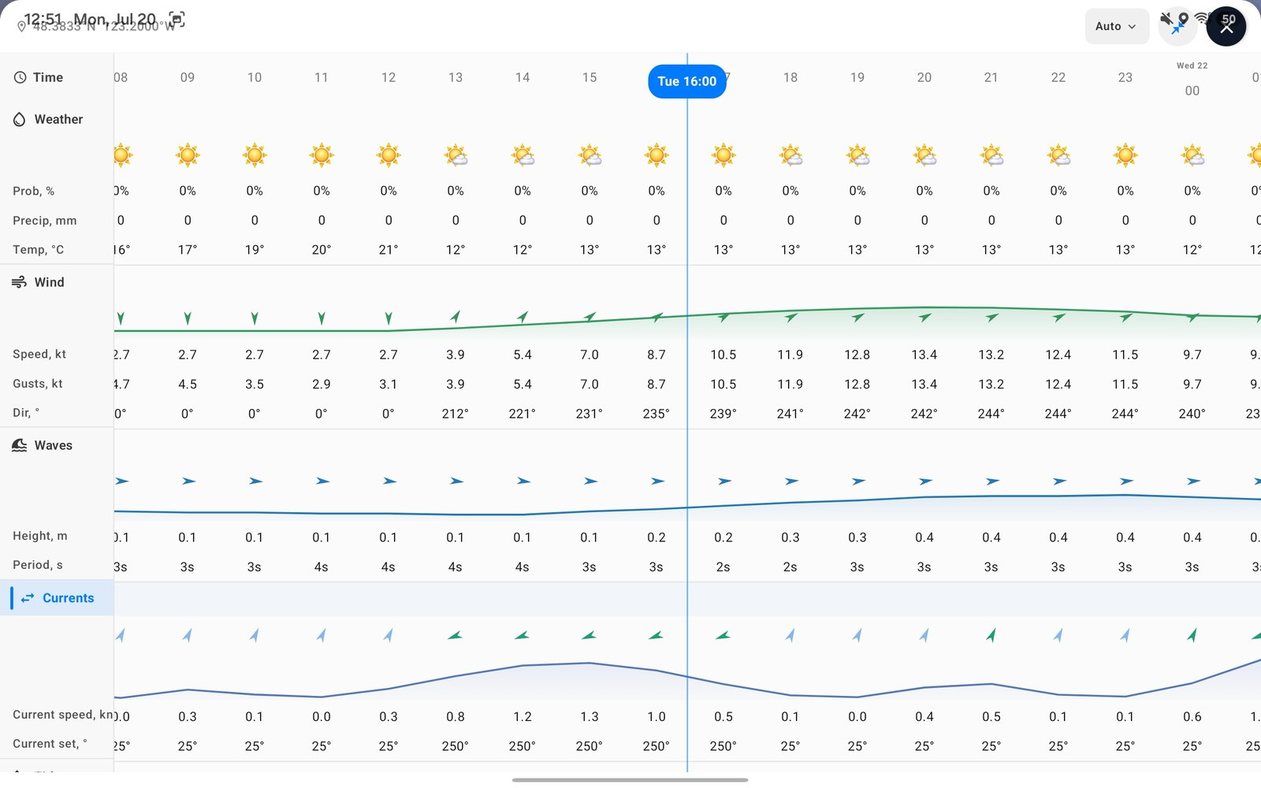
Each of these three layers animates over the chart with a scale to read against. Rain shows the cells and where they're tracking. Wind shows speed and gusts as flowing particles, so a shift or a lull reads at a glance before you check a single number. Waves show significant height across the area.
And you can step the forecast forward in time. This is how you find a weather window: not by reading a table, but by watching the conditions move across the water you'll actually be on — the wind building, a front and its rain arriving, the seas laying down behind it. Before an offshore leg, run wind and waves forward together and pick your moment.
Currents and tides: official stations, not a guess
Currents and tides are a different animal, and SeaVectors treats them differently on purpose. These don't come from a weather model — they come from official stations. That matters, because tidal current and tide height near the coast are driven by local geography a coarse global model can't capture, and hydrographic services publish station data precisely for that reason. (It's also why these two layers don't depend on the weather forecast at all.)
Switch to Currents and SeaVectors works from current stations, showing the current's set and speed — which way the water's moving and how hard. Near a headland, an inlet, or a tidal pass, that's the difference between a fast, comfortable transit and a slog against a foul stream, or wind‑against‑tide kicking up a nasty sea. Time your run with the flow and the same passage gets easier and drier.
Switch to Tides and it draws on tide stations for official predictions of the rise and fall. SeaVectors finds the relevant station for where you're looking, and you can center the map on the station it's using so you know exactly where the numbers apply. These are astronomical predictions from official sources — solid enough to plan a bar crossing or a thin‑water anchorage around.
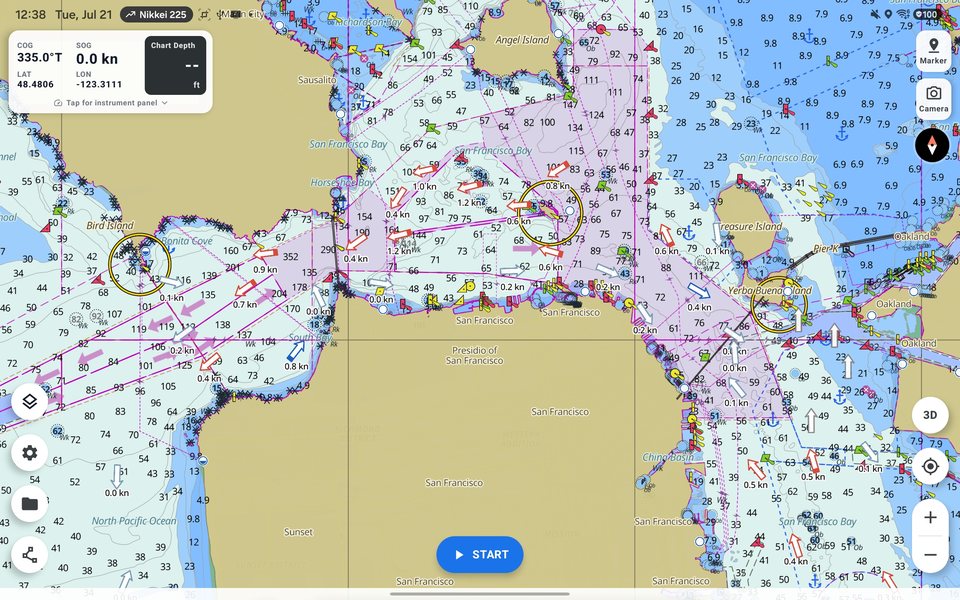
Image: the Currents overlay near a tidal pass with a station selected, set and speed shown. Caption: "Currents and tides read from official stations — SeaVectors picks the nearest and shows which one it's using."
They don't just sit there — they feed your instruments
Whichever layer you're viewing, SeaVectors reads the conditions at your position and feeds them to the instrument panel. So the wind, wave, current, and temperature widgets have real values to show even without dedicated sensors — and the picture on the chart and the numbers on your gauges are the same data, sampled where you are. Watch the overlay to plan; watch the panel underway.
Any layer goes full‑screen when you want to study it, and every one lets you scrub through the coming hours and days to time a departure, a pass, or a crossing.
A word on trust
Forecasts are forecasts — occasionally wrong, especially at the edges of a model's range. Station predictions are solid but assume calm weather; a hard onshore blow or a big pressure swing will push real water levels above or below the tide table, and set up seas the wave model didn't call. Treat all five layers as excellent planning information, cross‑check official forecasts and warnings, and keep a margin. Used that way, they make you a better‑prepared boater, not an overconfident one.
Why it matters
Rain, wind, waves, current, and tide are the questions every passage turns on. SeaVectors answers them where the question actually lives — on your official ENC chart, over the waters you're crossing — with forecast models you can choose for the weather and seas, and official station data for the currents and tides. Plan the day by watching it move, then let the same data ride along on your instruments while you sail it.
Start your 30‑day free trial on the App Store. For the full walkthrough, see our guides to and .