
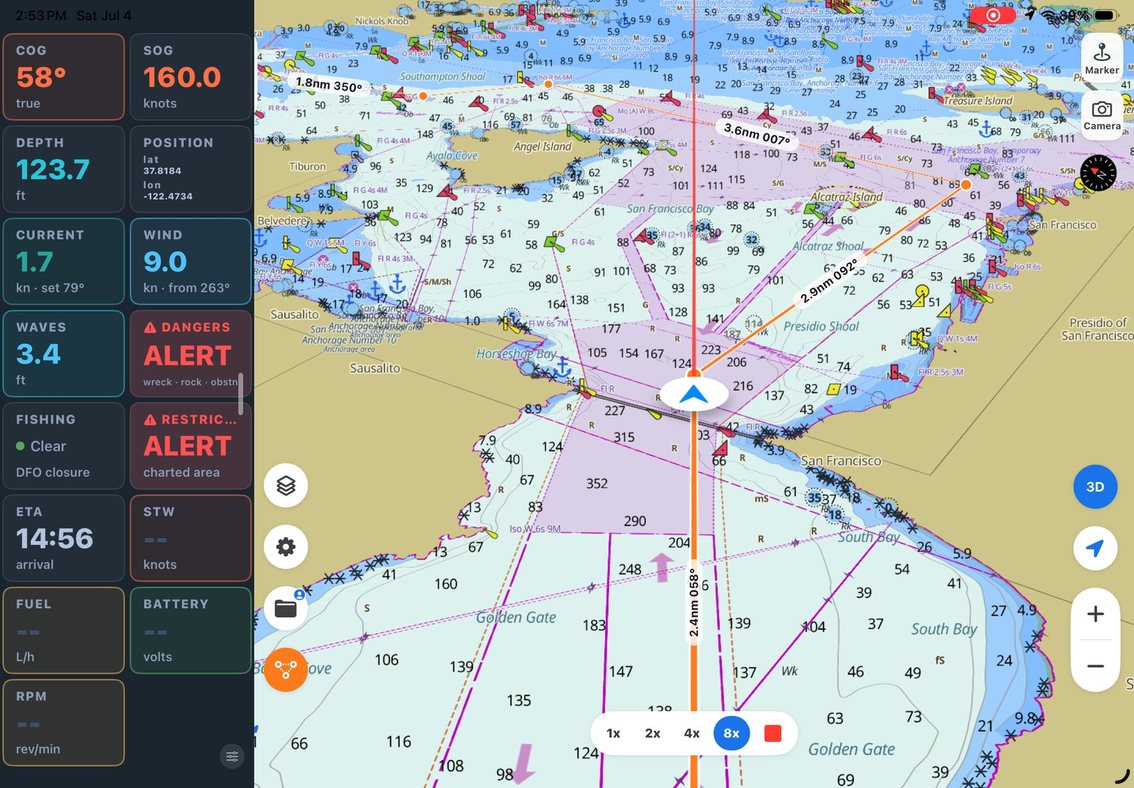
There are two kinds of electronic chart, and the difference matters more than it first appears. One is a scan — a photograph of a paper chart, zoomed until the ink blurs. The other is an ENC: the official chart delivered as data, where every depth area, contour, buoy, and cable is a real object the app understands and draws.
SeaVectors is the second kind. It renders official ENC charts — full US coverage from NOAA, plus high‑definition vector charts for the Canada West Coast — built from the S‑57 data standard and drawn with S‑52 symbology, the same look you'd find on a commercial ship's bridge. That's a mouthful, so here's what it actually buys you on the water.
Explore a harbor or passage you know and tap the ENC objects you normally rely on. The 30-day free trial includes the complete experience, so you can judge the clarity and depth of SeaVectors charting for yourself before deciding whether to subscribe.
- Download SeaVectors on the App Store
- Get SeaVectors on Google Play
- Not ready to install? Open the lightweight web chart for a quick preview.
It stays sharp, because it isn't a picture
Zoom into a scanned chart and you eventually hit the grain of the original paper. Zoom into an ENC and it simply redraws itself — the coastline stays clean, the soundings stay legible, the symbols keep their shape. There's no "native scale" you're fighting against, no pixelation at the exact moment you're threading a narrow entrance and want more detail, not less.
That alone would justify vector charts. But the sharpness is a side effect of the real advantage: the app knows what everything is.
The colors and symbols are a language
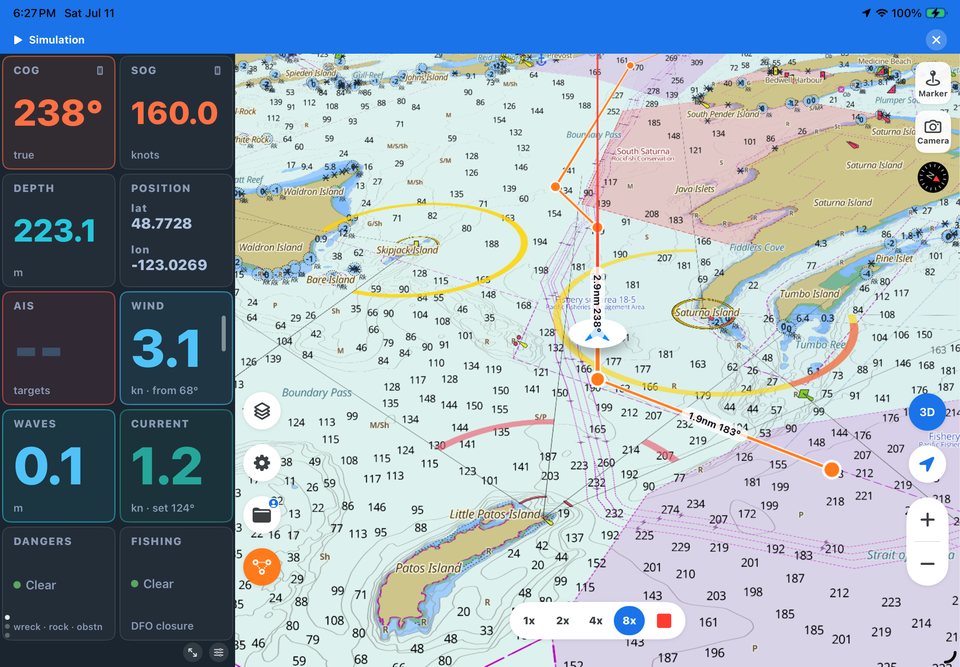
S‑52 is a standard for how chart data is drawn, and its whole point is consistency. A depth band is always the same shade of blue for the same range of water. A light, a wreck, a restricted area — each has a defined symbol that means the same thing everywhere, day or night. Learn it once and you can read any ENC without hunting for a legend.
SeaVectors leans into that. Shallow water and drying areas stand out from safe water. Depth contours connect equal depths; soundings drop the individual spot‑depth numbers where you need them. And because it's the standardized presentation, what you see on your phone matches what a mariner sees on a professional plotter looking at the same waters.
Prefer real imagery under the chart? Switch to the satellite style to read a shoreline or find a marina entrance, then back to nautical for open‑water work. Four base styles — nautical, night, satellite, relief — all sit over the same authoritative ENC data. Switching the look never changes the facts underneath.
Tap anything, and the chart explains itself
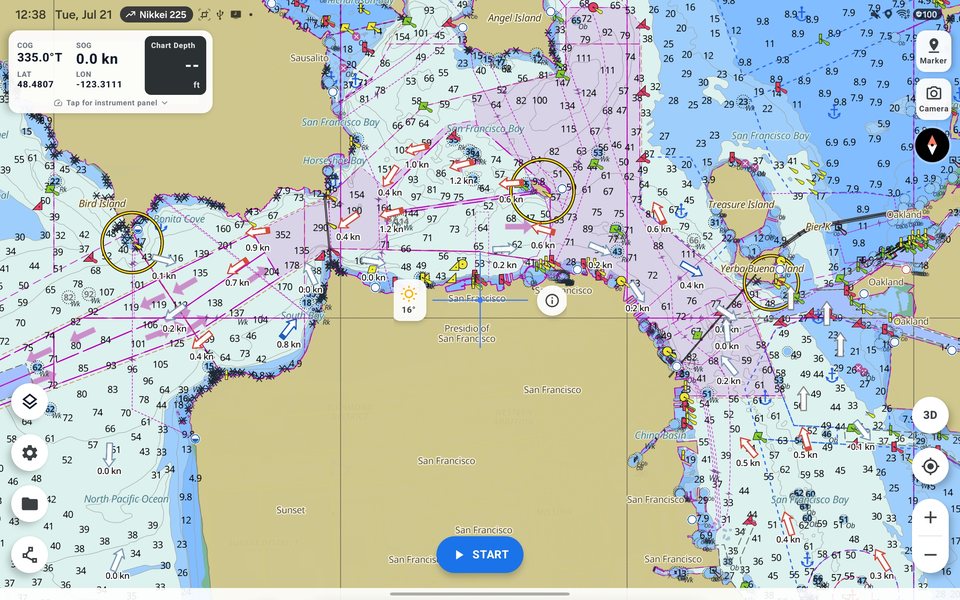
Here's the part that a paper legend can never do. On an ENC, every object carries its official attributes — so in SeaVectors you just tap it. Tap a light and read its characteristics. Tap a buoy, a restricted area, a depth area, and an info sheet tells you exactly what it is, straight from the chart data.
This changes how you handle uncertainty. Instead of squinting at an unfamiliar symbol and guessing, you tap it and know. The chart stops being a static image you interpret and becomes something you can interrogate.
You decide how much to see
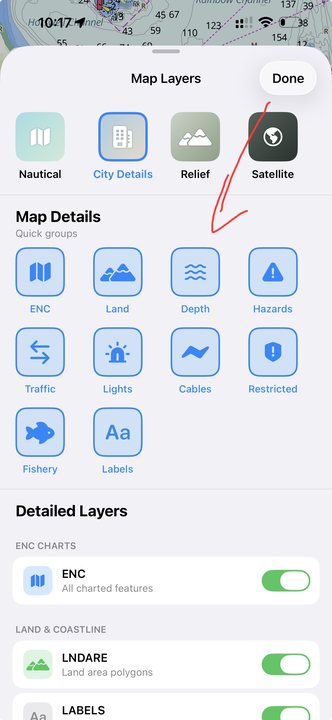
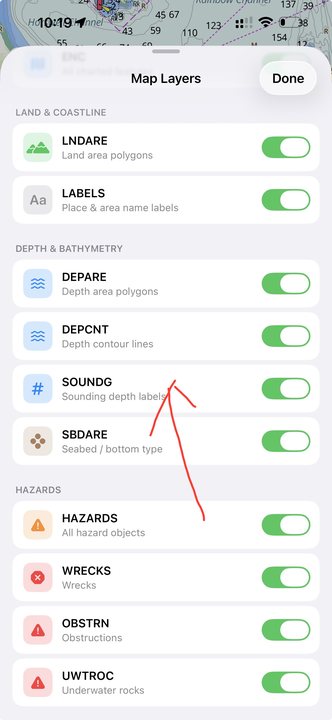
An ENC contains everything — every sounding, cable, closure, and label. That's the strength of official data and, in a busy area, its challenge. SeaVectors lets you control it. Turn labels off for a clean passage view. Keep depth and hazards on when you're threading a shallow entrance. Bring up seabed type when you're hunting good holding for the night. The chart declutters to the job in front of you and clutters back up when you need the detail.
Why it matters
A chart you can read at a glance, trust to the official standard, and question object‑by‑object is a different tool from a photo of a paper chart. It's the difference between looking at the chart and looking into it.
That's the foundation everything else in SeaVectors is built on — the routes you plan, the AIS targets you assess, the weather you overlay, all of it sits on authoritative ENC data drawn the professional way. Get comfortable reading the chart and the rest of the app clicks into place.
Start your 30‑day free trial on the App Store and see your home waters in proper ENC detail. Want the step‑by‑step? Read our guide to reading the chart and controlling map layers.